srl_muni#
Physical literacy and reading performance of children in schools in Amazonas.
Description#
This is a dataset from an association, cross-sectional, quantitative study carried out with Amazonian schoolchildren (n=100; aged between 10 and 13 years) from 3 public schools in the municipality of Borba (Amazonas).
Usage#
srl_muni = get_dataset("srl_muni")
Format#
‘srl_muni’ A data frame with 100 rows and 17 columns:
school#
School of observation
sex#
Sex - 1 for Masculine and 2 for Feminine
age#
Age (in years)
weight_kg#
Weight in kilograms (kg)
height_m#
Height in meters (m)
bmi#
Body Mass Index (BMI)
bmi_status#
Body Mass Index Status - A categorical description of the BMI.
phv#
Peak Height Velocity (PHV) is a continuous variable, measured by age (in years) relative to the peak height in the period where maximum rate of growth occurs and this is an indication of maturity.
phv_state#
Categorical description for Peak Height Velocity (PHV).
eses#
Exercise Self-Efficacy Scale measures how confident the students are with regard to carrying out regular physical activities and exercise, measured by a psychometric scale.
pmc#
Perceived Motor Competence (PMC) assesses the child’s self-perception regarding their ability to perform motor movements. Measured by a psychometric scale.
kupa#
Knowledge and Understanding of Physical Activity (KUPA) - Evaluates knowledge regarding the benefits, safety, and engagement in physical activity. Measured by scores obtained in objective questions.
sb#
Sedentary Behavior - Evalutes the exposition time to sedentary behaviors. Measured by psychometric scale.
pa#
Physical Activity (PA) - Level of physical activity in children, based on the frequency and duration of routine daily activities. Measured by score on the physical activity frequency questions.
mc#
Motor Competence - Supine To Stand (in seconds) - Measures the time (in seconds) it takes for the child to stand up from the floor, from a supine position to a standing position.
tde#
Total Score on the TDE test - Measures reading level based on time and accuracy in word reading.
tde_categorical#
Categorical description of the TDE Score.
Source#
https://tede.ufam.edu.br/handle/tede/10627
Example#
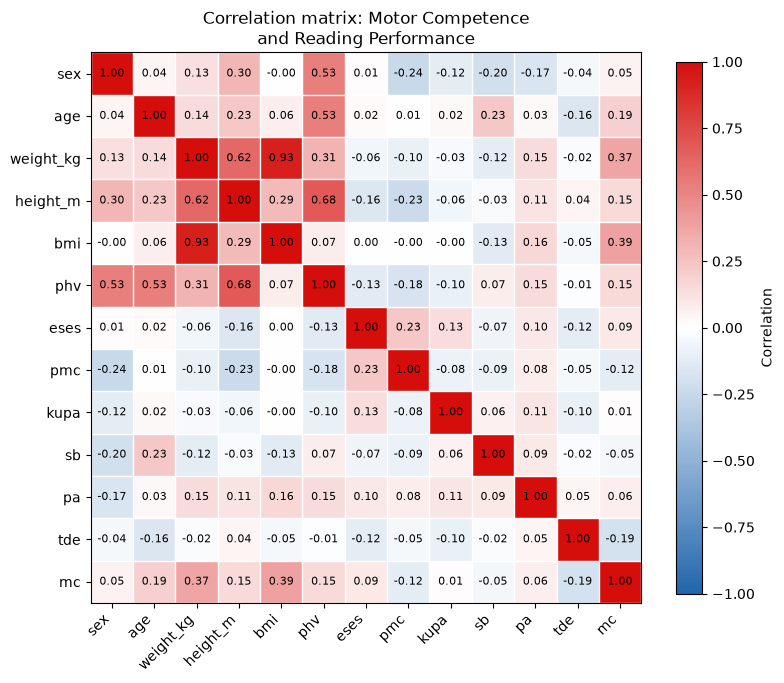
import matplotlib.pyplot as plt
import numpy as np
from matplotlib.colors import LinearSegmentedColormap
from amazonasdatahub.datasets import get_dataset

srl_muni = get_dataset("srl_muni")

# Selecting numeric variables and computing the correlation matrix
corr = srl_muni.select_dtypes("number").corr()
labels = corr.columns

# Plotting the correlation matrix
cmap = LinearSegmentedColormap.from_list("corr", ["#2166AC", "white", "#d50e0b"])

fig, ax = plt.subplots(figsize=(8, 8))
im = ax.imshow(corr.values, cmap=cmap, vmin=-1, vmax=1)

ax.set_xticks(np.arange(len(labels)), labels=labels, rotation=45, ha="right")
ax.set_yticks(np.arange(len(labels)), labels=labels)

# Cell borders and value labels
ax.set_xticks(np.arange(-0.5, len(labels), 1), minor=True)
ax.set_yticks(np.arange(-0.5, len(labels), 1), minor=True)
ax.grid(which="minor", color="white", linewidth=1)
ax.tick_params(which="minor", length=0)

for i in range(len(labels)):
    for j in range(len(labels)):
        ax.text(j, i, f"{corr.values[i, j]:.2f}", ha="center", va="center", fontsize=8)

fig.colorbar(im, ax=ax, shrink=0.7, label="Correlation")
ax.set_title("Correlation matrix: Motor Competence\nand Reading Performance")
plt.tight_layout()
plt.show()