prf_amazonas#
Traffic accident data from Amazonas recorded by Federal Highway Police (PRF) in 2025
Description#
Traffic accident data from Amazonas 2025
Usage#
prf_amazonas = get_dataset("prf_amazonas")
Format#
‘prf_amazonas’ A data frame with 116 rows and 30 variables:
id#
Record ID
date#
Date of the record - yyyy-mm-dd
days_of_week#
Day of the week
time#
Hour of the record
federative_unit#
Federative unit (UF)
br#
Federal Highway
km#
Kilometer of BR
municipality#
Municipality
accident_cause#
Accident cause
accident_type#
Accident type
accident_classification#
Accident classification: victims, no victims, unharmed victims, fatal victims
road_direction#
Road direction
weather#
Weather conditions at the time of the accident
track_type#
Track type: Simples, Múltipla ou Dupla
track_layout#
Track layout
land_use#
Land use
people#
People involved in the accident
deceased#
Death toll
minor_injuries#
Number of victims with minor injuries
serious_injuries#
Number of victims with serious injuries
unharmed#
Number of unharmed victims
ignored#
Ignored
harmed#
Number of harmed victims
latitude#
Latitude
longitude#
Longitude
regional#
Superintendency of the Federal Highway Police of Brazil
police_station#
Police station where the report was filed
operating_unit#
Operating unit and police station
Source#
Brasil. Polícia Rodoviária Federal (PRF). Dados Abertos da PRF: Acidentes de Trânsito. https://www.gov.br/prf/pt-br/acesso-a-informacao/dados-abertos/dados-abertos-da-prf.
Example#
import matplotlib.pyplot as plt
from amazonasdatahub.datasets import get_dataset

# Load dataset
prf_amazonas = get_dataset("prf_amazonas")

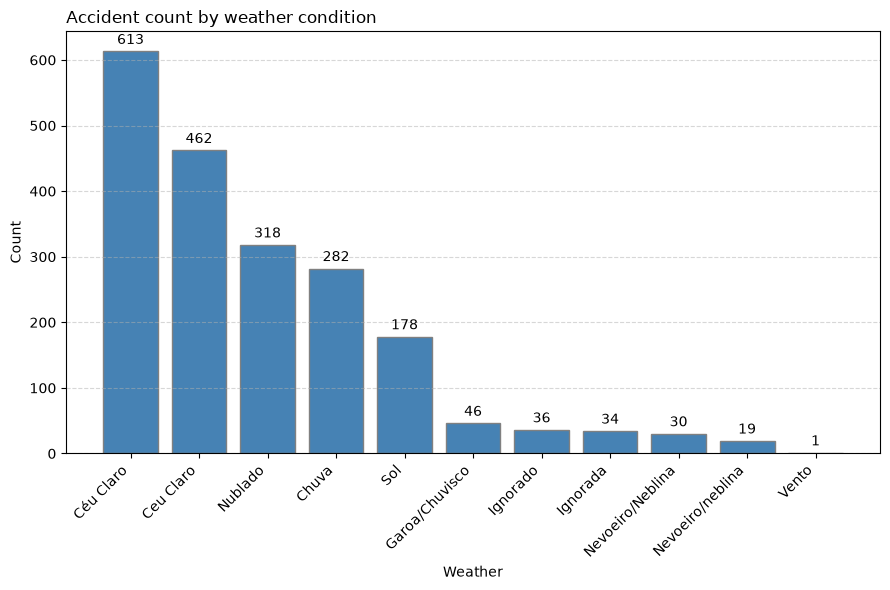
# Count occurrences by weather condition (automatically sorted descending)
counts = prf_amazonas["weather"].value_counts()

# Plot bar chart
fig, ax = plt.subplots(figsize=(9, 6))
bars = ax.bar(counts.index, counts.values, color="steelblue", edgecolor="gray")

# Add text labels on top of bars
ax.bar_label(bars, padding=3)

# Titles and labels
ax.set_title("Accident count by weather condition", loc="left")
ax.set_xlabel("Weather")
ax.set_ylabel("Count")

plt.xticks(rotation=45, ha="right")
plt.grid(axis="y", linestyle="--", alpha=0.5)
plt.tight_layout()
plt.show()