aids_amazonas#
A dataset of AIDS occurrences from 2011 to 2023 in Amazonas
Description#
This dataset contains data of the AIDS occurrences in each municipality from Amazonas.
Usage#
aids_amazonas = get_dataset("aids_amazonas")
Format#
‘aids_amazonas’ A data frame with 48 rows and 21 columns:
code_muni#
Municipality code
name_muni#
Municipality name
cases#
Case count
gender#
Gender of the infected individual - M for Male and F for female
year#
Year of observation
Source#
https://indicadores.aids.gov.br
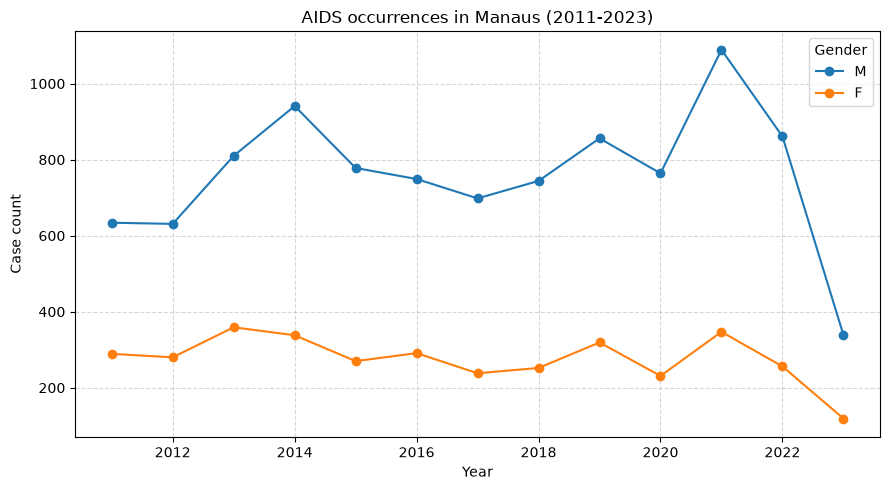
Example#
import matplotlib.pyplot as plt
from amazonasdatahub.datasets import get_dataset

# Load dataset
aids_amazonas = get_dataset("aids_amazonas")

# Filter by municipality and pivot data by gender
manaus_aids = aids_amazonas[aids_amazonas["name_muni"] == "Manaus"]
pivot_aids = manaus_aids.pivot(
    index="year", columns="gender", values="cases"
)

# Plot line chart
pivot_aids.plot(marker="o", figsize=(9, 5))

# Titles, labels and custom configurations
plt.title("AIDS occurrences in Manaus (2011-2023)")
plt.xlabel("Year")
plt.ylabel("Case count")
plt.legend(title="Gender")
plt.grid(True, linestyle="--", alpha=0.5)
plt.tight_layout()
plt.show()