malaria_amazonas#
An integrated dataset of malaria notifications in the state of Amazonas
Description#
This dataset contains medical records of patients who underwent malaria screening tests in the Legal Amazon. The data in this dataset were filtered to include only the cases reported in the state of Amazonas and for patients who reside specifically in the state of Amazonas between 2014 and 2019.
Usage#
malaria_amazonas = get_dataset("malaria_amazonas")
Format#
‘malaria_amazonas’ A data frame with 551633 rows and 35 columns:
notification_state#
State of notification
notification_rh#
Health region of notification
notification_county#
County of notification
infection_country#
Probable county where the patient was infected
infection_state#
Probable state where the patient was infected
infection_hr#
Probable health region where the patient was infected
infection_county#
Probable county where the patient was infected
home_country#
Country of residence of the patient
home_state#
State of residence of the patient
home_hr#
Health region of residence of the patient
home_county#
County of residence of the patient
exam_interval#
Time interval between notification and examination
treatment_interval#
Time interval between examination and beginning of treatment
notification_interval#
Time interval between symptom and notification
notification_month#
Month in which the notification was recorded
notification_year#
Year in which the notification was recorded
symptom_month#
Month in which the patient felt the first symptoms of malaria
symptom_year#
Year in which the patient felt the first symptoms of malaria
exam_month#
Month in which the examination was performed
exam_year#
Year in which the examination was performed
treatment_month#
Month in which the treatment started
treatment_year#
Year in which the treatment started
migration#
Health region of residence different than that of notification
autochthonous_case#
Health region of infection identical to that of residence
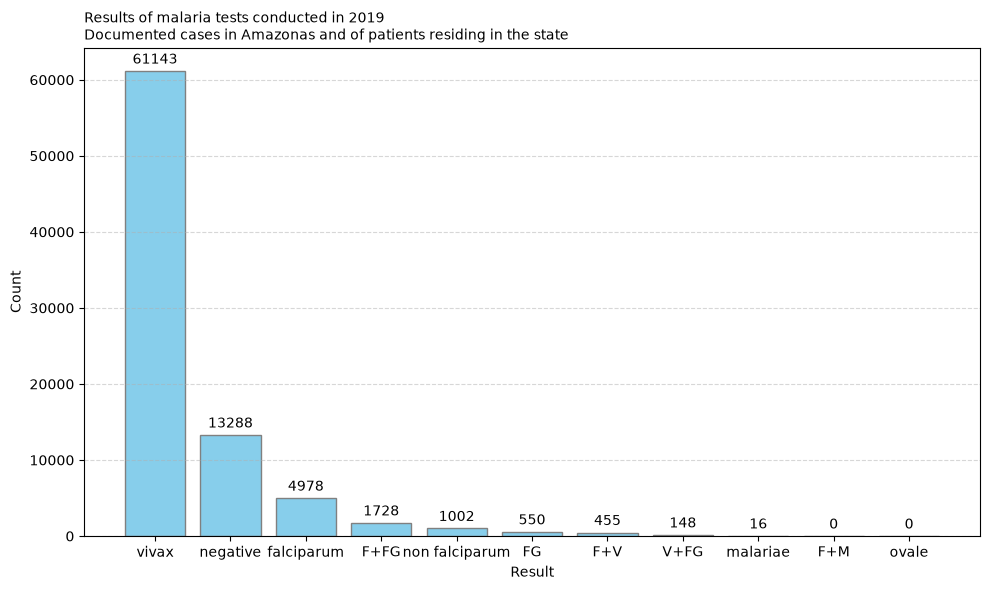
exam_result#
Result of examination
detection_type#
Type of detection
exam_type#
Type of examination
symptom#
Indicates if the patient felt a symptom
hemiparasite#
The result of the examination for other hemiparasites
previous_treatment#
Previous treatment for P. vivax or P.falciparum
occupation#
Main activity in the last 15 days
education_level#
Level of education of the patient
age#
Interval of the age of the patient
race#
Race/color of the patient
gender#
Gender of the patient
pregnancy#
Indicates pregnancy and the gestational age
crosses#
Indicates the amount of parasitemia in crosses
cvl_case#
Indicates the existence of cases of canine visceral leishmaniasis
scheme#
Indicates the treatment scheme employed
qty_parasites#
Indicates the number of parasites per mm^3
month#
The month in which this data was observed
Source#
https://www.synapse.org/Synapse:syn21552203/files
Example#
import matplotlib.pyplot as plt
from amazonasdatahub.datasets import get_dataset

# Load dataset
malaria_amazonas = get_dataset("malaria_amazonas")

# Filter by year 2019 and count exam results
counts = (
    malaria_amazonas[malaria_amazonas["exam_year"] == 2019]["exam_result"]
    .value_counts()
)

# Plot bar chart
fig, ax = plt.subplots(figsize=(10, 6))
bars = ax.bar(counts.index, counts.values, color="skyblue", edgecolor="gray")

# Add text labels on top of bars
ax.bar_label(bars, padding=3)

# Titles and labels
ax.set_title(
    "Results of malaria tests conducted in 2019\nDocumented cases in Amazonas and of patients residing in the state",
    fontsize=10,
    loc="left"
)
ax.set_xlabel("Result")
ax.set_ylabel("Count")

plt.grid(axis="y", linestyle="--", alpha=0.5)
plt.tight_layout()
plt.show()