humidity_manaus#
Time series with Extreme Values of Limited Range
Description#
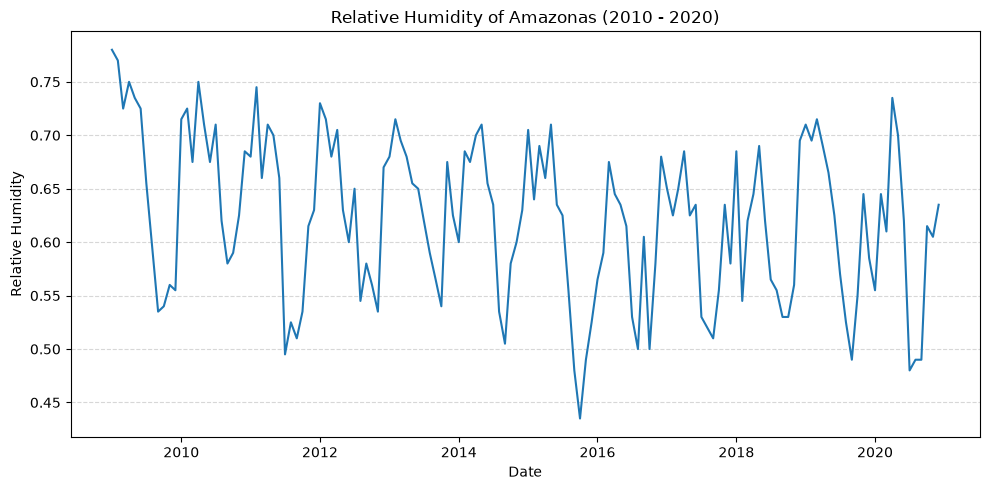
A time series dataset consisting of the minimum relative humidity observed in the city of Manaus from January 2009 to December 2020. This dataset is a sample of size n = 144 monthly blocks.
Usage#
humidity_manaus = get_dataset("humidity_manaus")
Format#
‘humidity_manaus’ A tibble with 144 rows and 5 columns
year#
The year in which this data was observed
rh#
Relative Humidity
dbt#
Dry Bulb Temperature
wbt#
Wet Bulb Temperature
month#
The month in which this data was observed
Source#
NASCIMENTO, Leonardo Brandão Freitas; LIMA, Max Sousa; DUCZMAL, Luiz H. P-min-stable regression models for time series with extreme values of limited range. Environmetrics, Issue 2, v. 36, 2025.
Example#
import matplotlib.pyplot as plt
import pandas as pd
from amazonasdatahub.datasets import get_dataset

# Load dataset
humidity_manaus = get_dataset("humidity_manaus")

# Create date column from year and month
humidity_manaus["date"] = pd.to_datetime(
    humidity_manaus["year"].astype(str)
    + "-"
    + humidity_manaus["month"].astype(str)
    + "-01"
)

# Sort by date for proper line plotting
humidity_manaus = humidity_manaus.sort_values("date")

# Plot time series
fig, ax = plt.subplots(figsize=(10, 5))
ax.plot(
    humidity_manaus["date"], humidity_manaus["rh"], color="tab:blue", lw=1.5
)

# Titles and labels
ax.set_title("Relative Humidity of Amazonas (2010 - 2020)")
ax.set_xlabel("Date")
ax.set_ylabel("Relative Humidity")

plt.grid(axis="y", linestyle="--", alpha=0.5)
plt.tight_layout()
plt.show()