rionegro_amazonas#
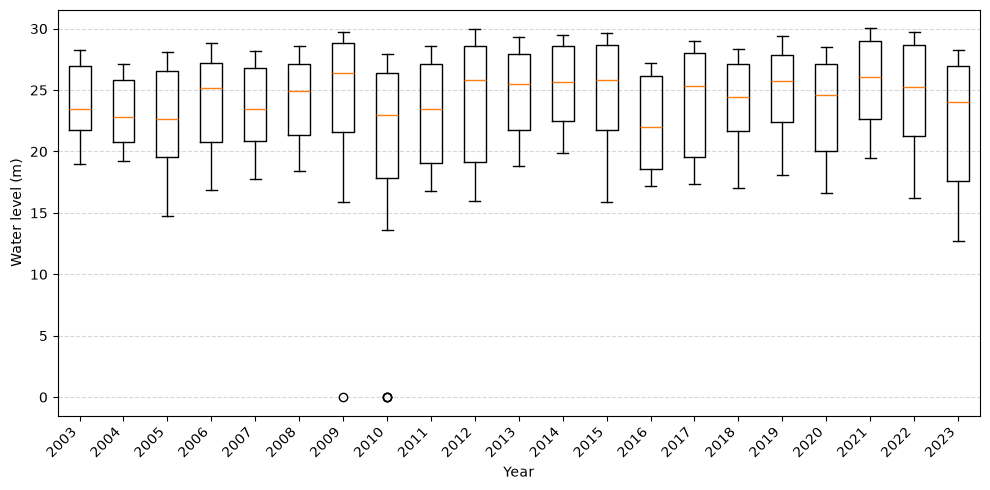
A dataset of the Rio Negro River (Amazonas) level from 2003 to 2023.
Description#
This dataset contains data of the Rio Negro River level in the state of Amazonas (Brazil), compiling information on years, semesters and days, along with the river’s level in meters and whether it filled or dropped (in centimeters).
Usage#
rionegro_amazonas = get_dataset("rionegro_amazonas")
Format#
‘rionegro_amazonas’ A data frame with 8003 rows and 7 columns:
level_m#
River level in meters
increase_decrease_cm#
Wheter the river level filled or dropped (in centimeters)
day#
Measurement day
month#
Measurement month
year#
Measurement year
semester#
Measurement semester
Source#
https://portodemanaus.com.br/nivel-do-rio-negro/
Example#
import matplotlib.pyplot as plt
from amazonasdatahub.datasets import get_dataset

# Load dataset
rionegro_amazonas = get_dataset("rionegro_amazonas")

# Prepare data for boxplot grouped by year
years = sorted(rionegro_amazonas["year"].unique())
data_by_year = [
    rionegro_amazonas[rionegro_amazonas["year"] == yr]["level_m"].dropna()
    for yr in years
]

# Plot boxplot
fig, ax = plt.subplots(figsize=(10, 5))
ax.boxplot(data_by_year, tick_labels=years)

# Labels
ax.set_xlabel("Year")
ax.set_ylabel("Water level (m)")

plt.xticks(rotation=45, ha="right")
plt.grid(axis="y", linestyle="--", alpha=0.5)
plt.tight_layout()
plt.show()