agriculture_amazonas#
Plant production data from the Institute of Sustainable Agricultural and Forestry Development of Amazonas - IDAM (2023).
Description#
This database, which is the consolidation of data from IDAM’s activity reports, provides crop production data for crops that this institute considers a priority.
Usage#
agriculture_amazonas = get_dataset("agriculture_amazonas")
Format#
‘agriculture_amazonas’ A data frame with 1072 rows and 13 columns:
municipality#
Municipality
local_unit#
Local Unit of the Institute
n_beneficiary#
Number of assisted beneficiaries
planted#
Planted area in hectares (ha)
harvested#
Harvested area in hectares (ha)
production#
Production (in the unit of measurement - measure)
estimated_n_beneficiary#
Estimate of the number of beneficiaries
estimated_planted#
Estimate of the planted area (ha)
estimated_harvested#
Estimate of the harvested area (ha)
estimated_production#
Estimate of production (in the unit of measurement - measure)
measure#
Unit of Measurement of production
cultivation#
Cultivation
year#
Year of cultivation
Source#
https://www.idam.am.gov.br/biblioteca/relatorio-de-atividades-rat-23-2/
Example#
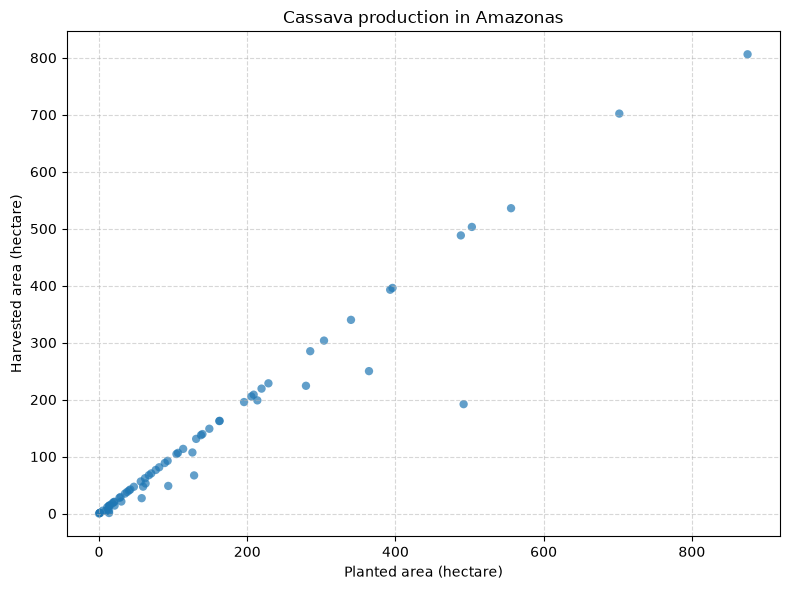
import matplotlib.pyplot as plt
from amazonasdatahub.datasets import get_dataset

# Loading data
agriculture_amazonas = get_dataset("agriculture_amazonas")

# Filtering data
mandioca_prod = agriculture_amazonas[
  agriculture_amazonas["cultivation"] == "Mandioca"
]

# Scatterplot
plt.figure(figsize=(8,6))
plt.scatter(
  mandioca_prod["planted"],
  mandioca_prod["harvested"],
  alpha=0.7,
  edgecolors="none"
)
plt.xlabel("Planted area (hectare)")
plt.ylabel("Harvested area (hectare)")
plt.title("Cassava production in Amazonas")
plt.grid(True, linestyle="--", alpha=0.5)
plt.tight_layout()
plt.show()