Accident count by weather condition
Importing the package
library(amazonasdatahub)
Accident count by weather condition
With the prf_amazonas database, we can perform data analysis of
accidents recorded by the Federal Highway Police (PRF) in the state of
Amazonas in the year 2025.
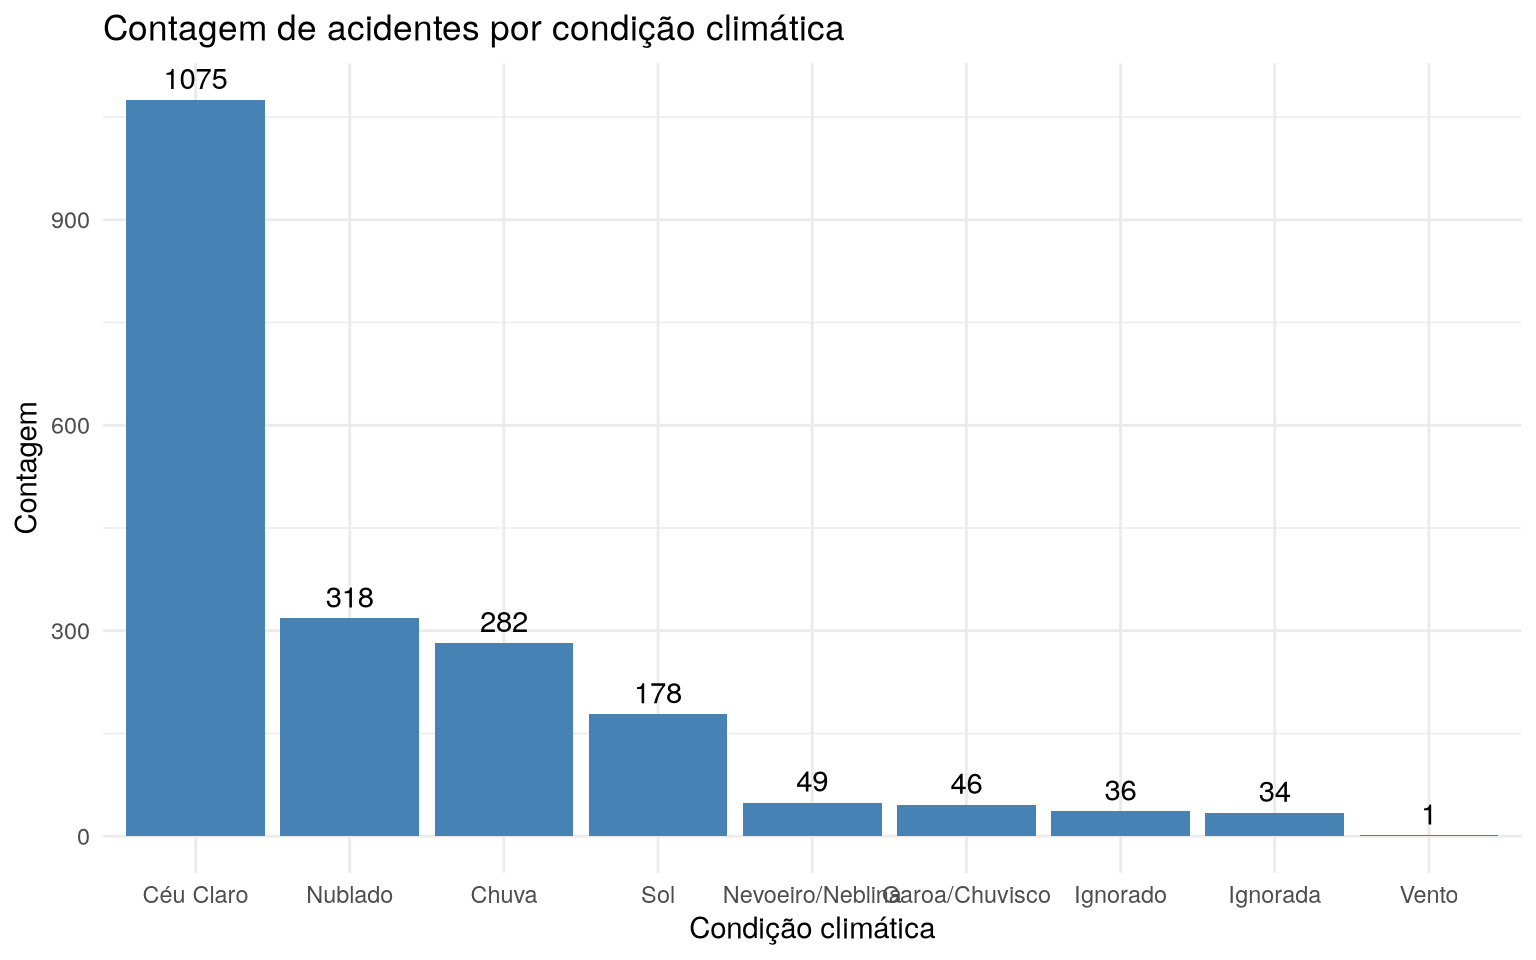
We can check the frequency of accidents by weather condition and identify which of these conditions presents a higher frequency of accidents.
# Importanto pacotes para organizacao e visualizacao de dados
require(dplyr)
require(forcats)
require(ggplot2)

# Contando acidentes agrupados por condicao climatica e fazendo o grafico
prf_amazonas %>%
  count(weather) %>%
  mutate(
    weather = fct_reorder(weather, -n)
  ) %>%
  ggplot(aes(x = weather, y = n)) +
  geom_bar(stat = "identity", fill = "steelblue") +
  geom_text(aes(label = n), vjust = -0.5) +
  theme_minimal() +
  labs(
    title = "Contagem de acidentes por condição climática",
    x = "Condição climática",
    y = "Contagem"
  )
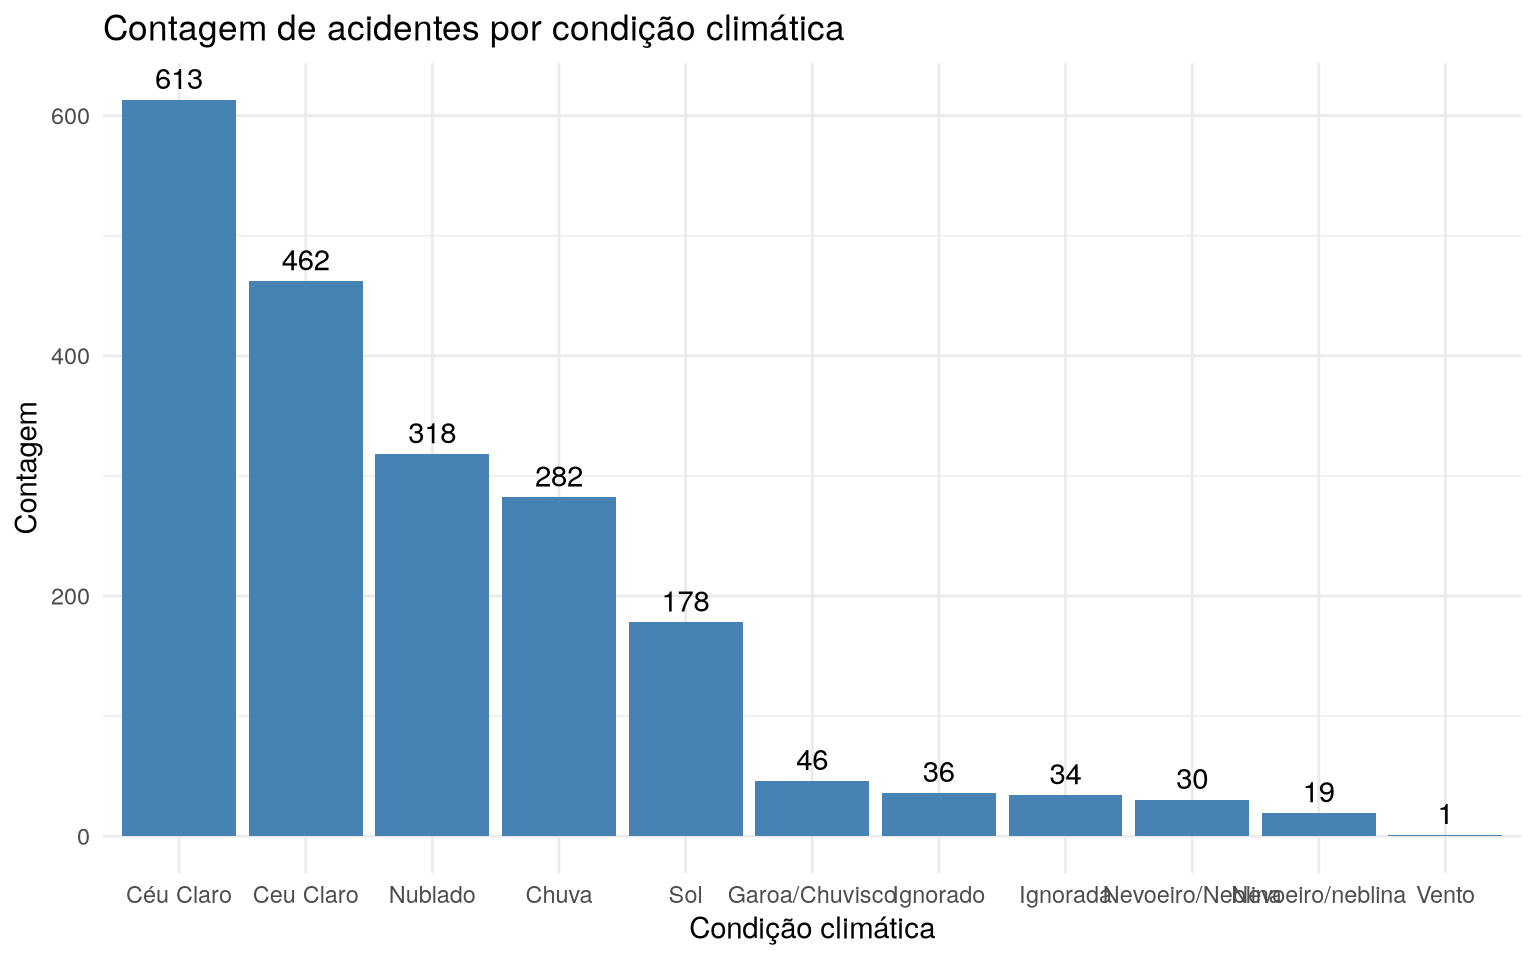
See that the Céu claro condition is divided, since one has
written with an acute accent Céu claro and another is without an acute accent,
Ceu claro. We can individually assess weather conditions
available to check if it makes sense.
unique(prf_amazonas$weather)
 [1] "Ceu Claro"        "Nublado"          "Ignorada"         "Chuva"
 [5] "Nevoeiro/neblina" "Sol"              "Vento"            "Céu Claro"
 [9] "Ignorado"         "Nevoeiro/Neblina" "Garoa/Chuvisco"
Note that in addition to Céu claro, we have Nevoeiro/Neblina and
Nevoeiro/neblina. This small change of capital letters already
interferes with data reading. So let's standardize
prf_amazonas_clean <- prf_amazonas %>%
  mutate(
    weather = case_when(
      weather == 'Ceu Claro' ~ 'Céu Claro',
      weather == 'Nevoeiro/neblina' ~ 'Nevoeiro/Neblina',
      TRUE~weather
    )
  )
It is now possible to view the bar graph of the corrected data.
prf_amazonas_clean %>%
  count(weather) %>%
  mutate(
    weather = fct_reorder(weather, -n)
  ) %>%
  ggplot(aes(x = weather, y = n)) +
  geom_bar(stat = "identity", fill = "steelblue") +
  geom_text(aes(label = n), vjust = -0.5) +
  theme_minimal() +
  labs(
    title = "Contagem de acidentes por condição climática",
    x = "Condição climática",
    y = "Contagem"
  )