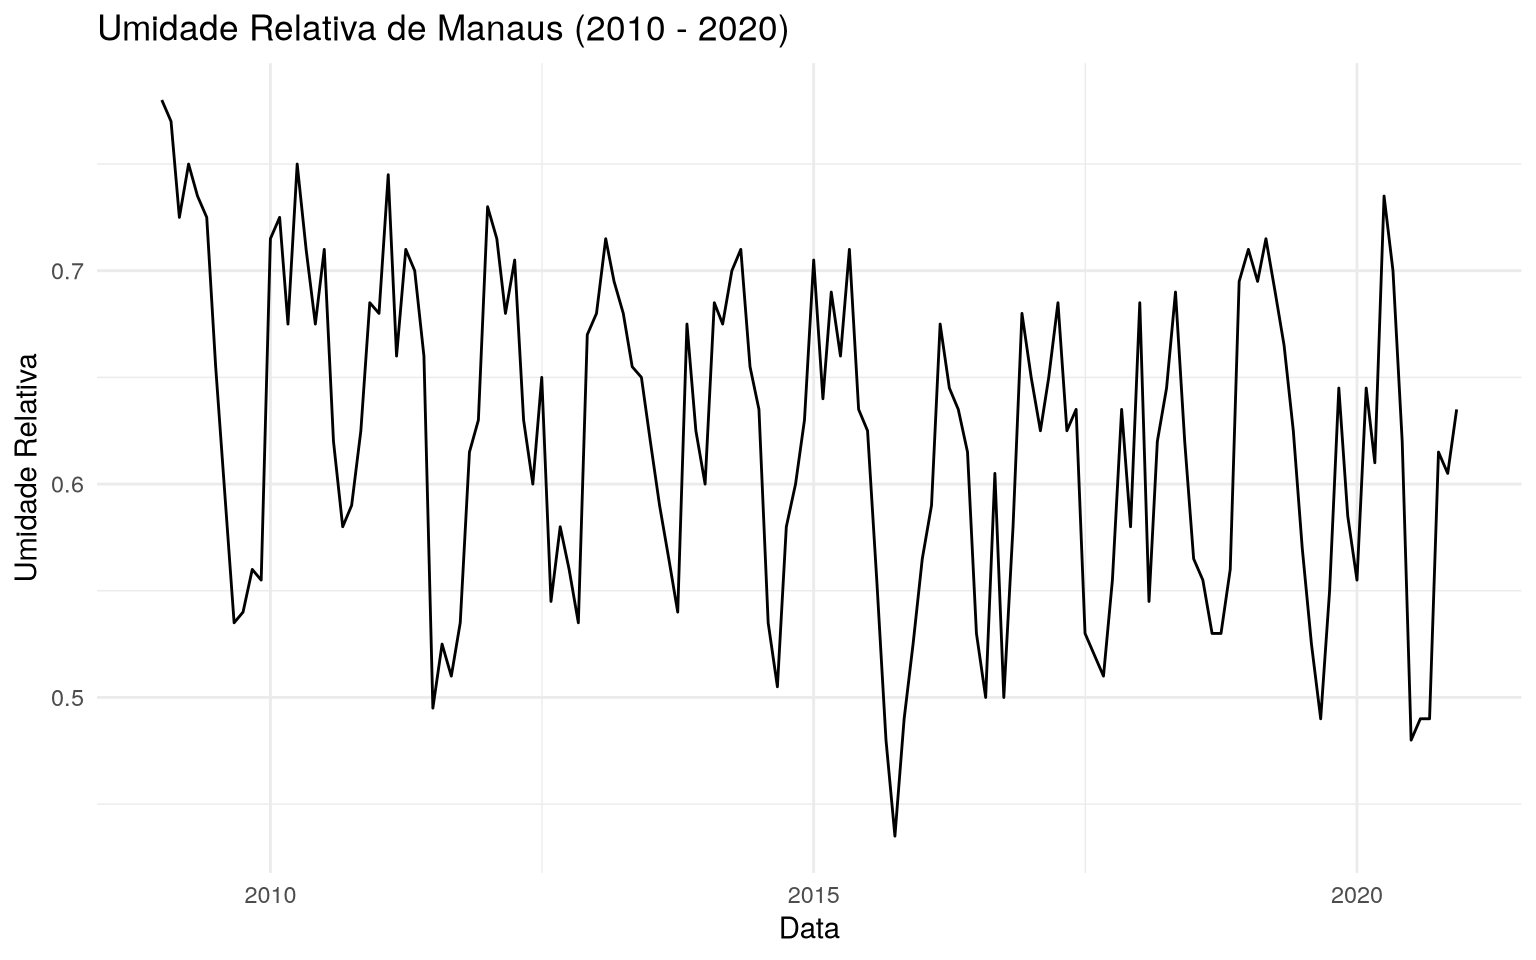
Manaus relative humidity time series (2010 - 2020)
Importing the package
library(amazonasdatahub)
Manaus relative humidity time series (2010 - 2020)
With the humidity_manaus dataset, which gathers humidity data
relative values observed in the city of Manaus from January 2009 to December
2020, we can check time series, and among them, humidity
relative during that time interval.
Using dplyr, we can create a date column, which will be composed
using the month and year data, and with ggplot2, we can create the graph.
# install.packages(c("dplyr", "ggplot2"))
require(dplyr)
require(ggplot2)

# Criando variavel de data unindo ano e mes, e em seguida,
# plotando o grafico
humidity_manaus %>%
  mutate(date = as.Date(paste0(year, "-", month, "-","01"))) %>%
  ggplot(aes(x = date, y = rh)) +
  geom_line() +
  theme_minimal() +
  labs(
    title = "Umidade Relativa de Manaus (2010 - 2020)",
    x = "Data",
    y = "Umidade Relativa"
  )