Incidence of AIDS in Manaus
Importing the package
library(amazonasdatahub)
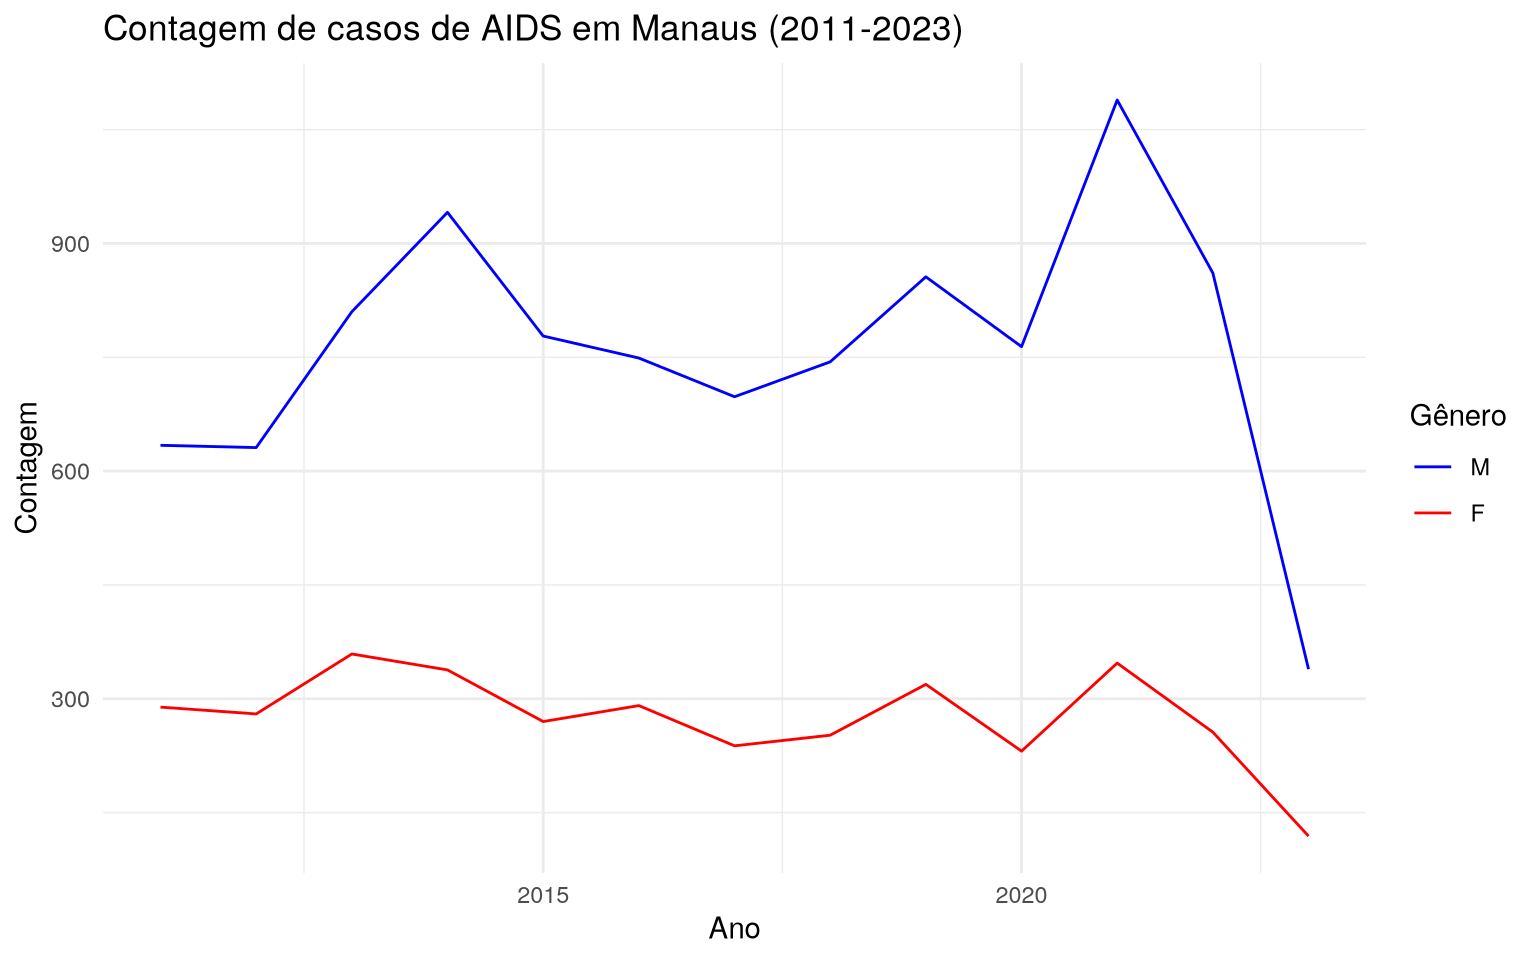
Time series of AIDS case counts in Manaus
The aids_amazonas database provides data on AIDS occurrences
in the municipalities of Amazonas.
One of the analyzes that can be done is: checking the time series of the
case count filtered from a given municipality, where the cases are
grouped by the sex of the individual observed. To do this,
we will use the dplyr packages to structure the data, and ggplot
to make the chart and customize it.
# install.packages(c("dplyr", "ggplot2", "lubridate"))
require(dplyr)
require(ggplot2)

# Filtrando dados, agrupando e plotando:
aids_amazonas %>%
  filter(name_muni == "Manaus") %>%
  group_by(gender) %>%
  ggplot(aes(x = year, y = cases, group = gender, color = gender)) +
  geom_line() +
  scale_color_manual(values = c("blue", "red")) +
  theme_minimal() +
  labs(
    title = "Contagem de casos de AIDS em Manaus (2011-2023)",
    x = "Ano",
    y = "Contagem",
    color = "Gênero"
  )