Correlation analysis between planted area and harvested area of vegetable production
Importing the package
library(amazonasdatahub)
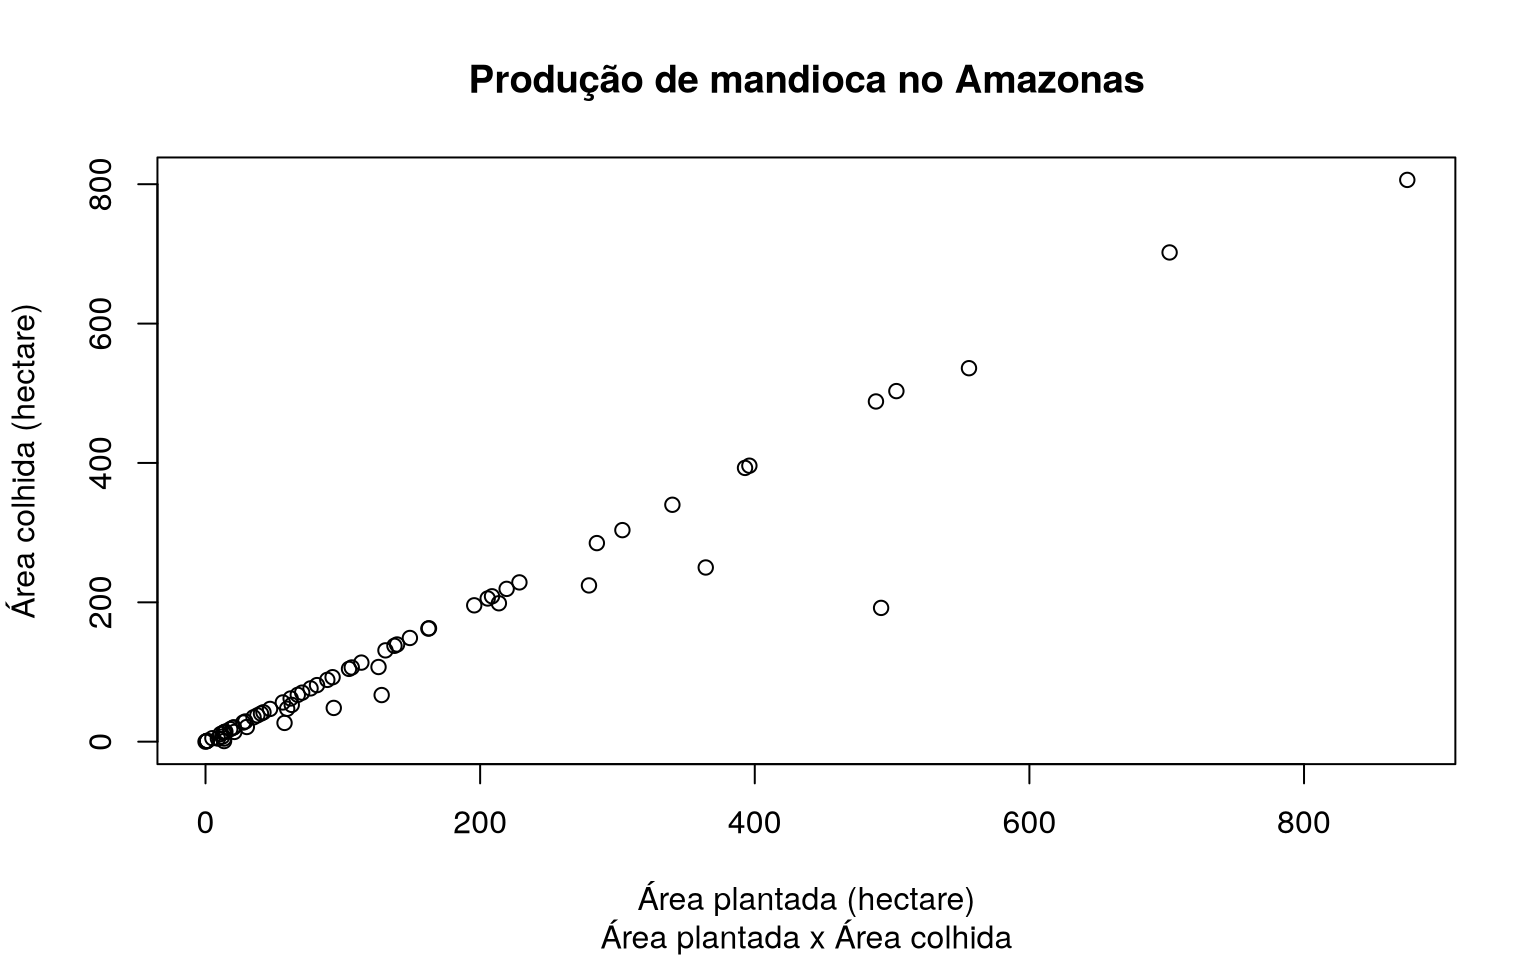
Scatterplot between planted area and harvested area of cassava production
The agriculture_amazonas database provides production data
agriculture in Amazonas. We can visualize the dispersion of the planted area and
of the area harvested from different productions, but for this example, we will use
cassava production data.
To plot a simple scatterplot in R without using other
packages, we will use the plot function.
# Filtrando dados
mandioca_prod <- agriculture_amazonas[agriculture_amazonas$cultivation == "Mandioca", ]

# Plotando o grafico
plot(
  mandioca_prod$planted,
  mandioca_prod$harvested,
  xlab = "Área plantada (hectare)",
  ylab = "Área colhida (hectare)",
  main = "Produção de mandioca no Amazonas",
  sub = "Área plantada x Área colhida"
)