neo_down
Description
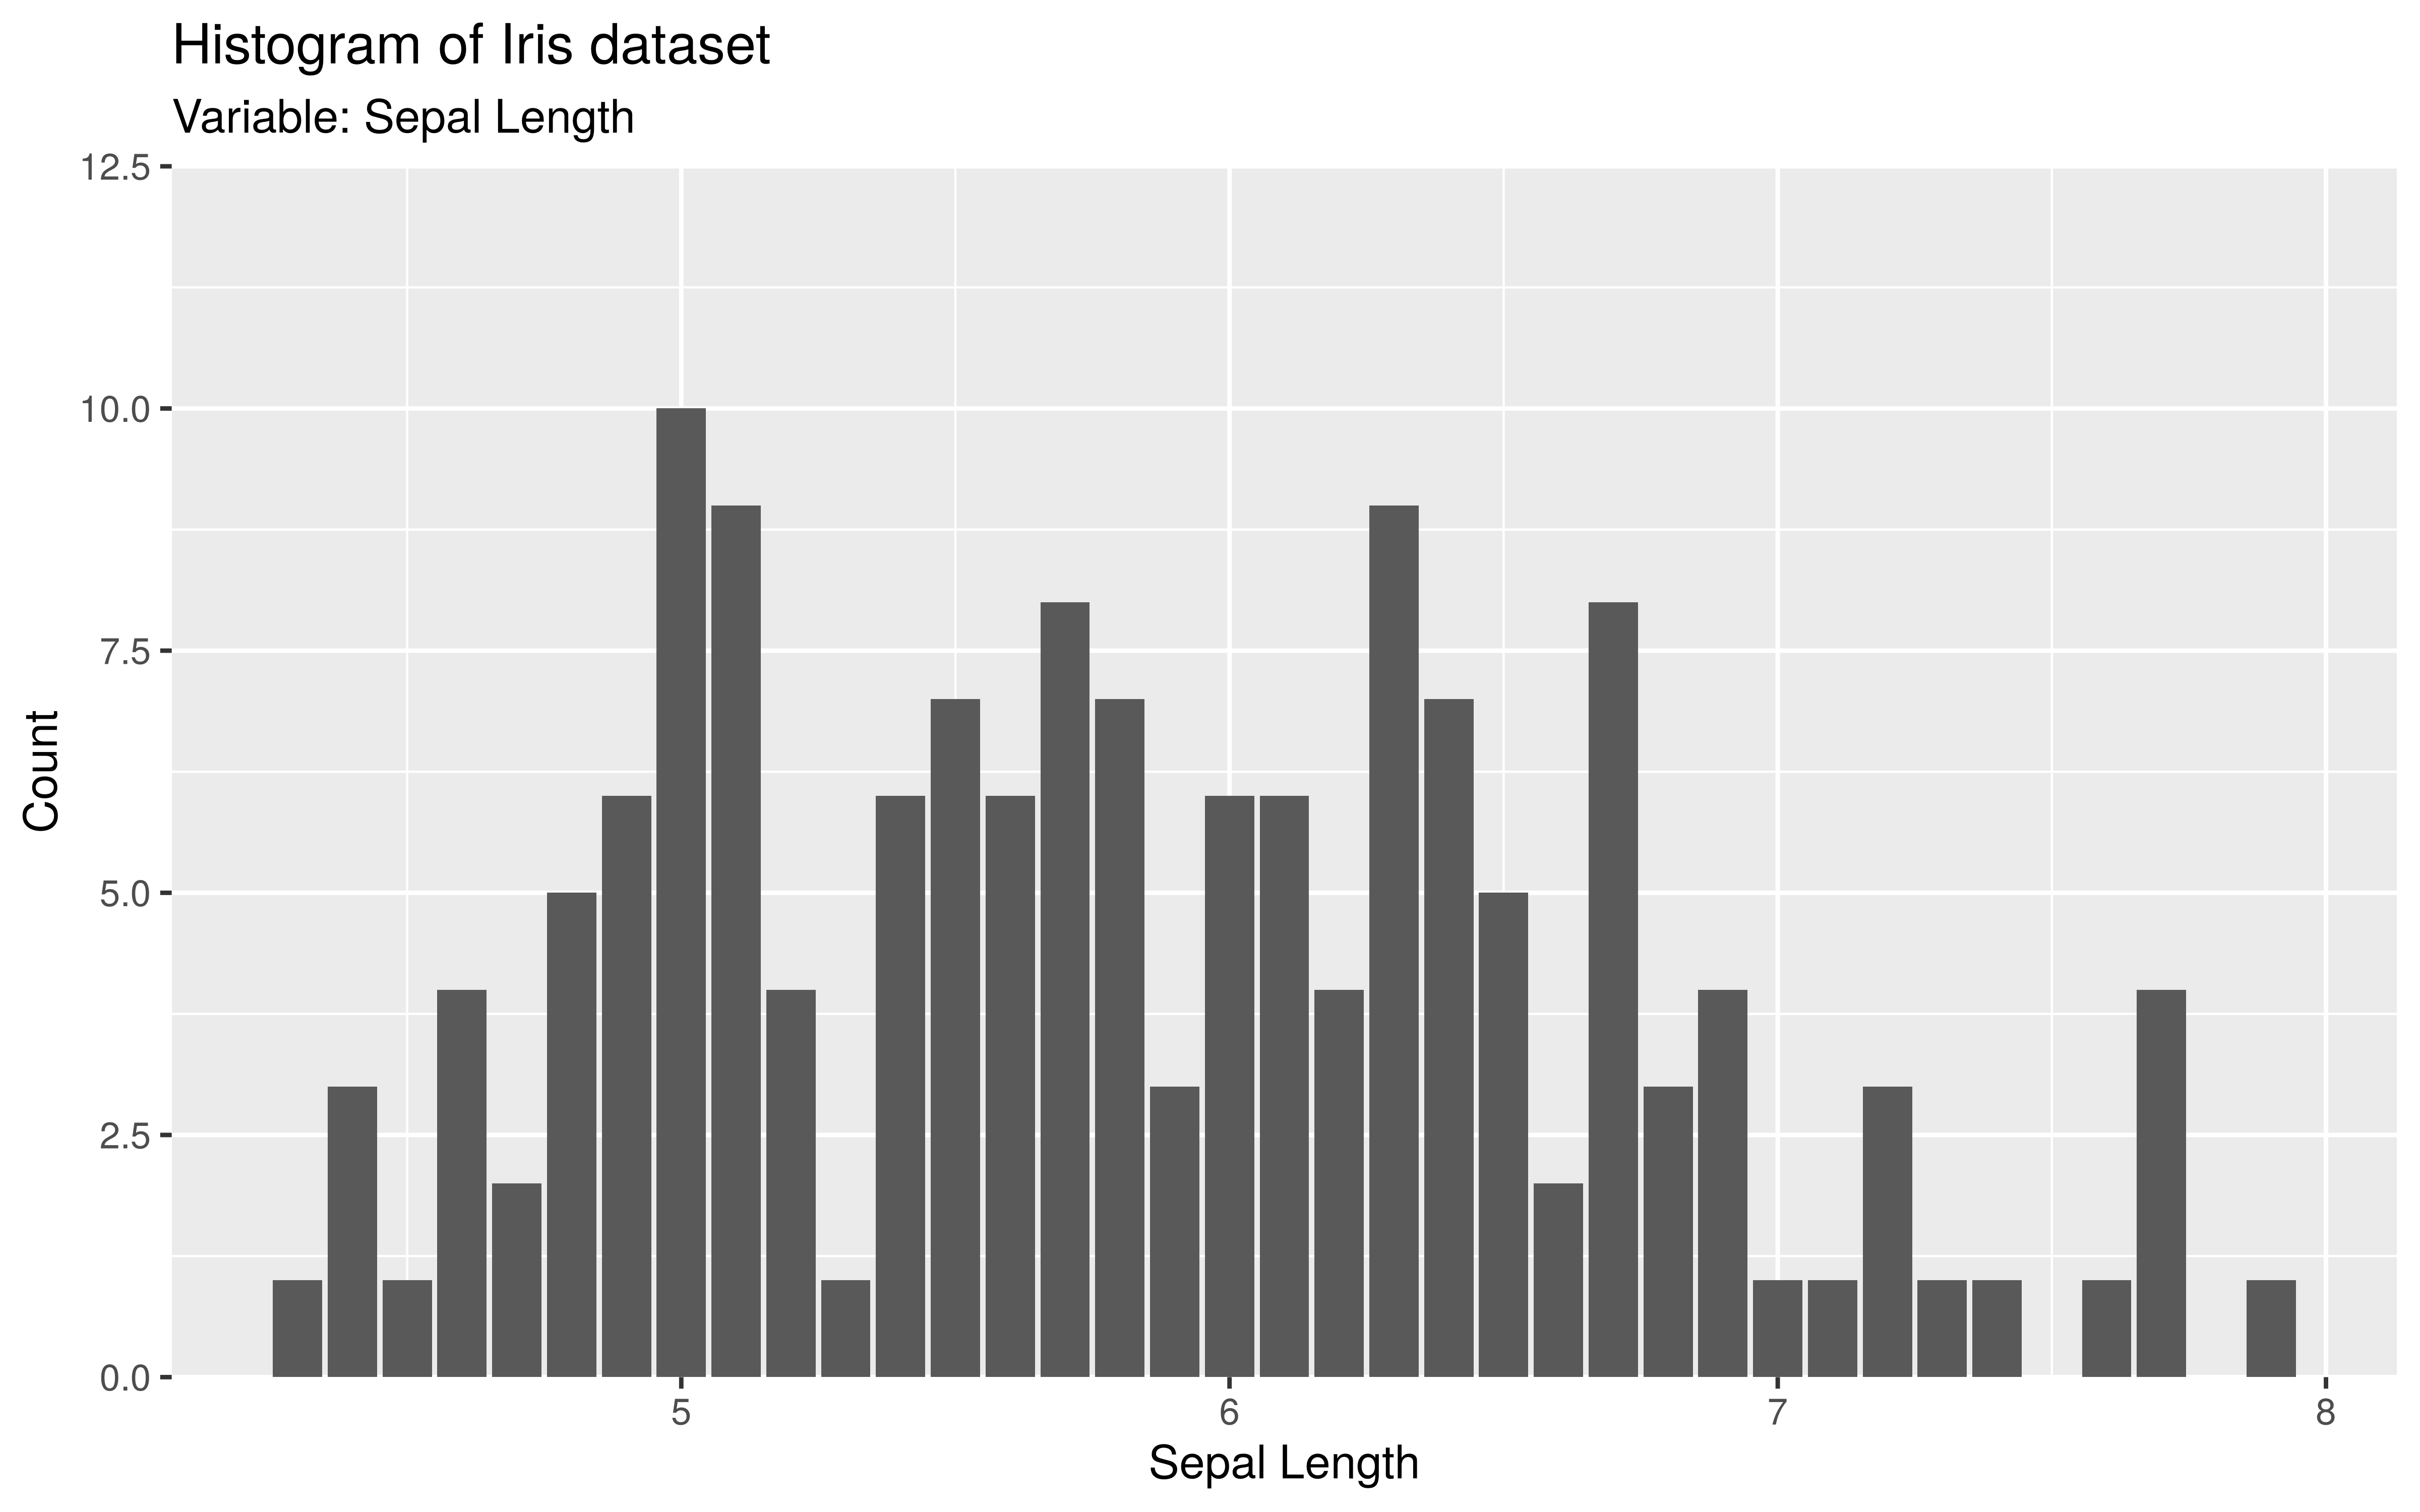
neo_down: Attach plot area to bottom (down). This function is useful to attach your plot data to the bottom (x line).
Usage
neo_down(add = 0.25)
Arguments
add: float value of additive range expansion constants. The default
value is 0.25. Recommended parameter value: 0.25 or 0.5.
Value
A ggplot scale_y_continuous object
Examples
library(ggplot2)
library(nelsonthemes)

ggplot(iris, aes(x = Sepal.Length)) +
geom_bar(stat = "count") +
  labs(
    title = "Histogram of Iris dataset",
    subtitle = "Variable: Sepal Length",
    x = "Sepal Length",
    y = "Count"
  ) +
  neo_down()