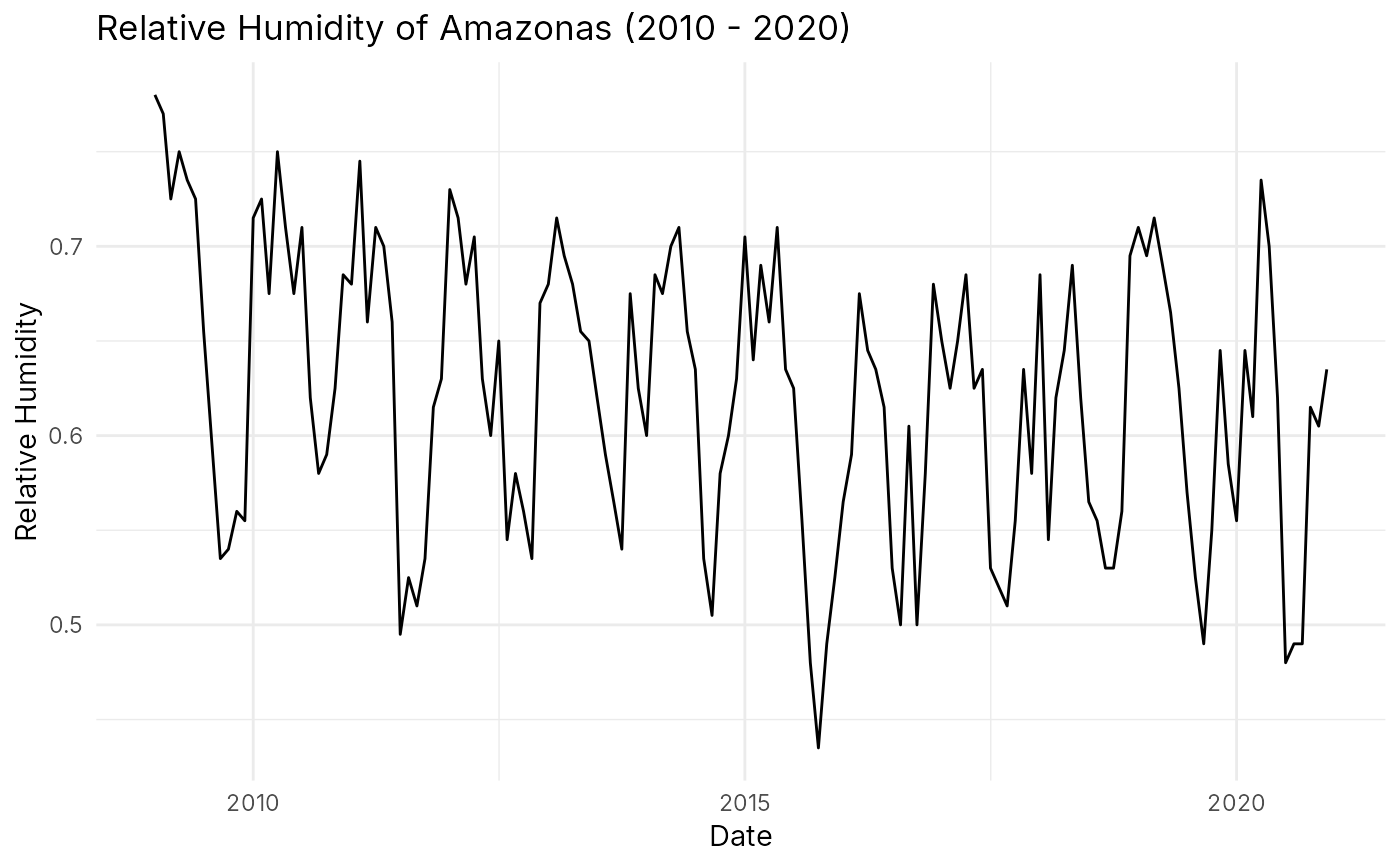
humidity_manaus - Time series with Extreme Values of Limited Range
humidity_manaus.RdA time series dataset consisting of the minimum relative humidity observed in the city of Manaus from January 2009 to December 2020. This dataset is a sample of size n = 144 monthly blocks.
Source
NASCIMENTO, Leonardo Brandão Freitas; LIMA, Max Sousa; DUCZMAL, Luiz H. P-min-stable regression models for time series with extreme values of limited range. Environmetrics, Issue 2, v. 36, 2025.
Examples
# Relative humidity time series of Amazonas
# Loading dplyr and ggplot to structure the data
require(dplyr)
require(ggplot2)

# Creating date column and plotting the time series
humidity_manaus %>%
  mutate(date = as.Date(paste0(year, "-", month, "-","01"))) %>%
  ggplot(aes(x = date, y = rh)) +
  geom_line() +
  theme_minimal() +
  labs(
    title = "Relative Humidity of Amazonas (2010 - 2020)",
    x = "Date",
    y = "Relative Humidity"
  )